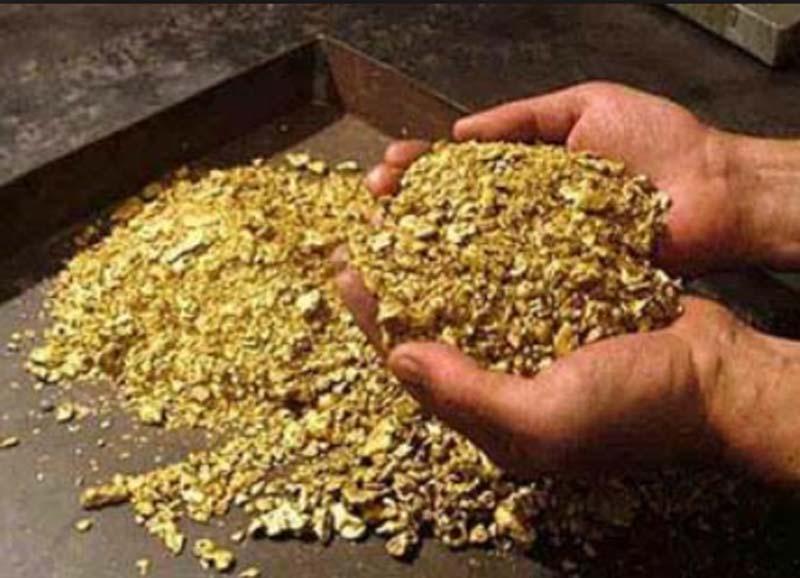
Gold has been one of the most profitable commodities in the last few months. Gold prices rose by about 16% this year and exceeded $ 1,420 an ounce in July 2019. Despite the negative effects of the US-China trade war, the rise in gold prices is due to increased purchases from large central banks and the participation of retail companies in the economy in the face of growing uncertainty. Nevertheless, gold has had its share of volatility in the last 50 years.

The dynamics of gold prices over the past 50 years
- Historically, average annual global gold prices have remained below $ 700 per ounce from 1970 to 2007.
- In 1980, gold prices rose to $ 850 per ounce (the average annual rate was $ 615 per year), which was due to huge inflation due to high oil prices, the Soviet intervention in Afghanistan and the consequences of the Iranian revolution, which caused investors to began to switch to metal.

- This period was followed by a restrained price environment, until the global financial crisis of 2008 affected the whole world, followed by a slowdown in growth in the eurozone.
- A double increase increased the price of gold as a hedging instrument, which led to an increase in world price levels, which since 2010 have risen above $ 1,100 per ounce.
- The average annual price of gold was the highest in 2012 due to purchases from large central banks to diversify their asset base, high demand for jewelry and rising inflation.

Comparison of gold prices with mining for 50 years
- Gold prices have largely maintained their feedback on output from 1970 to 2018.
- However, after 2012, prices fell sharply, despite the fact that the level of production increased only slightly, mainly due to the growth of the US economy.

- Over the past year, gold prices have experienced significant volatility regardless of global production dynamics due to trade tensions between the US and China.
- After the 2008 crisis, rising demand and gold prices led major players to explore new mines, leading to an increase in world production over the past 10 years.

The main sources of production
- South Africa's position as the dominant gold producing country for most of the 20th century (which accounted for nearly 70% of global gold production in the 1970s) has been eroded over the past two decades.
- Based on data on the main sources of gold production over the past 15 years, it was mainly produced by advanced economies such as the United States and Australia, while the share of South Africa fell from 14% in 2004 to 4% in 2018.

- After the financial crisis of 2008, China took this opportunity and steadily increased its dominant position: the country's share in world gold production increased from 10% to more than 15% in 2016.

- However, due to the weakness of the Chinese economy in the past two years, China has ceded part of its share of production to other countries such as Peru.
- In general, the locus of world gold mines production seems to be shifting from the Big Three (i.e. South Africa, the US and Australia) to emerging markets.

What lies ahead
Given the volatility of gold prices over the past 50 years, no one can guess how prices will change, although the general consensus of the market seems to indicate that we can see a further increase in gold prices in the near future.

